Action potential counting
Action Potential Counting analysis provides automatic detection of action potentials (APs) and calculation of:
Rheobase
First-spike latency
Inter-spike interval
Spike-frequency accommodation
Run spike counting analysis
Clicking the Count APs button on the Action Potential Counting analysis panel will run the analysis. By default, every record in the file is analyzed. To select specific records to analyze set the Records to Analyze box at the bottom of the analysis panel.
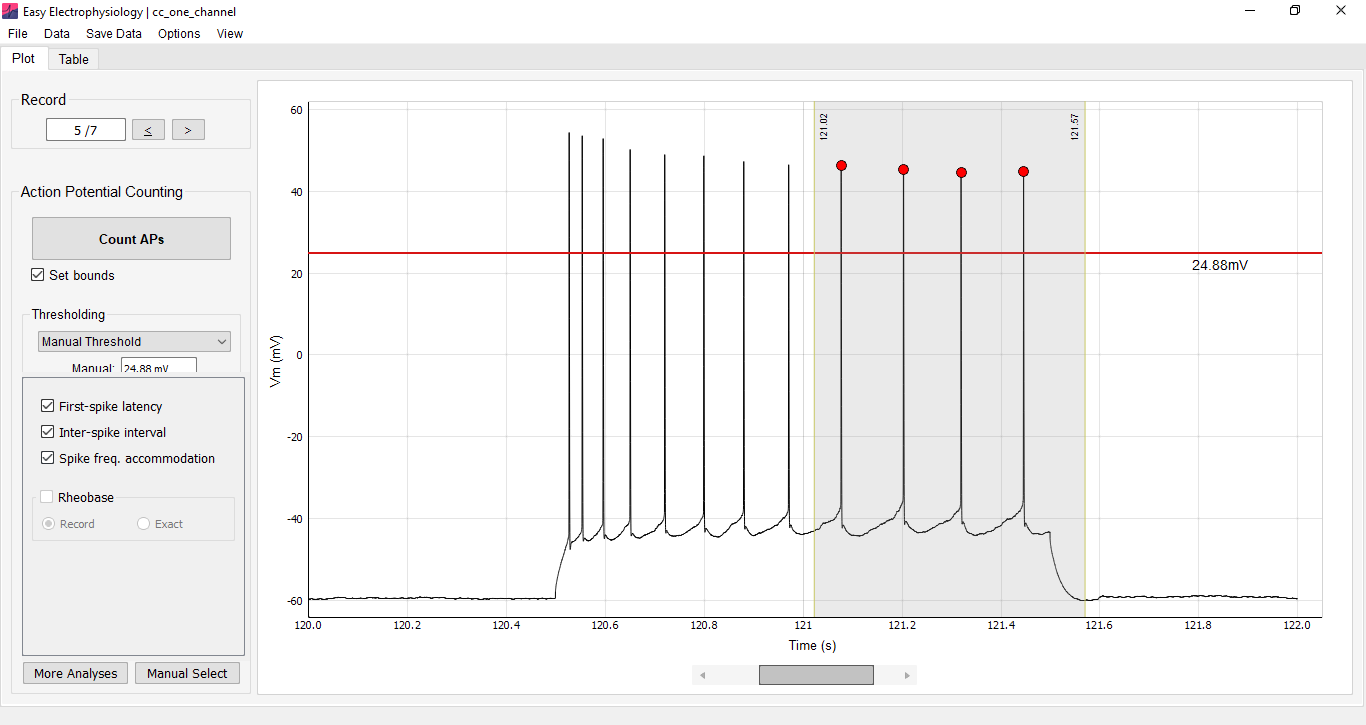
To restrict the analysis to a specific time period, click Set bounds. To change the spike-detection algorithm, use the drop-down menu in the Thresholding box on the analysis panel. More detail on these detection algorithms is given below.
To calculate the rheobase, \(I_\mathrm{m}\) input is required. This can be initialized by clicking the Im checkbox. See Input resistance for more detail on \(I_\mathrm{m}\) measurement.
Spike detection methods
Three spike-detection algorithms are provided – Auto. Threshold Record, Auto. Threshold Spike, and Manual Threshold – which differ in their sensitivity and approach.
Detection parameters
Automatic spike detection uses five parameters to detect spikes:
Amplitude (mV) – Minimum amplitude of a spike to be considered an action potential.
Rise (mV/ms) – This captures the rising phase of the action potential. Spikes must exceed this threshold to be considered an action potential.
Fall (mV/ms) – This captures the repolarizing phase of the action potential. This threshold criterion will only be applied if the rise threshold is passed within the period set by Width (ms).
Width (ms) – Period to search for a sample crossing the fall threshold after the rise threshold is crossed.
Min. distance between APs – The minimum distance in milliseconds between two action potentials. When two APs are closer than this distance, the smaller will be excluded.
These parameters can be adjusted through Options › Action Potential Counting Options.
Detection approaches
Auto. Threshold Spike – Detects action potentials using the threshold parameters described above. This option is useful for dynamic spike waveforms and instances where non-linear trends in the peak amplitudes preclude use of a straight-line threshold.
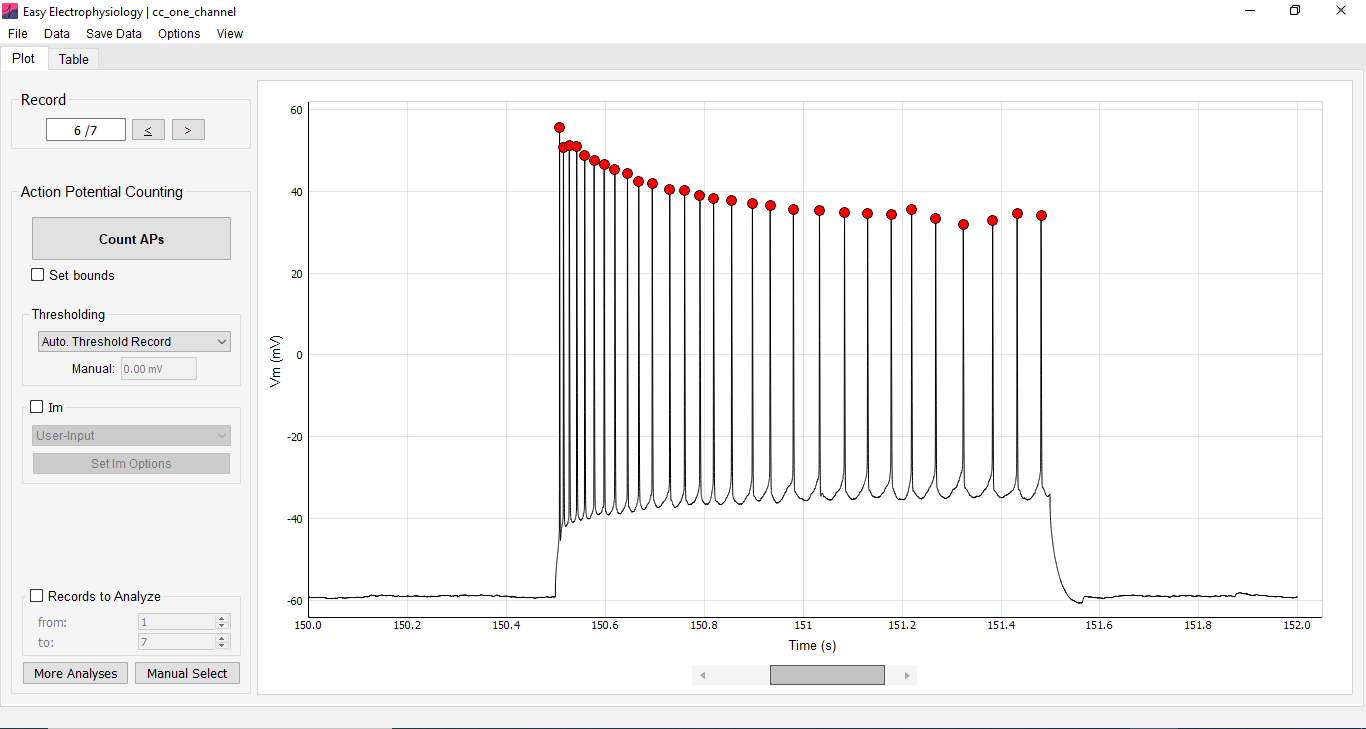
Auto. Threshold Record – Provides a robust alternative to individual action potential detection by averaging across all detected spikes to generate an absolute threshold.
First, an Auto. Threshold Spike approach is used to detect action potentials. Then, the median amplitude mid-point \(V_\mathrm{m}\) is calculated from all detected action potentials. This is used as a straight-line threshold over which any spike crossing is considered an action potential.
This method reduces the number of erroneously detected action potentials, particularly in noisy data as edge-case spikes are downweighted. This is the default setting for spike detection.
Manual Threshold – The simplest method. When selected, a red threshold bar appears on the plot. Any spike which rises above then falls below this threshold will be counted as an action potential.
Manual spike selection and editing
Following AP counting, detected events may be discarded or undetected events manually selected.
To select an AP, click the Manual Select button on the Action Potential Counting panel. The cursor will change to a crosshair and clicking and dragging on the graph will draw a circle allowing selection of an AP peak. To allow maximum flexibility, these selections are not thresholded and the maximum \(V_\mathrm{m}\) in the selected region will be taken as the new spike peak.
To discard detected APs, click twice on the filled red circle at the peak of an AP. The first click will prime the AP for deletion (the peak circle will turn blue) and the second click will delete the event from analysis.
Manual editing of detected action potentials will update all existing results (e.g. rheobase, first-spike latency, mean inter-spike interval, spike-frequency accommodation).
Action Potential Counting Options
Rheobase
Rheobase refers to the smallest current injection that elicits an action potential. Rheobase analysis is enabled when the Im checkbox is active (see Input resistance for details on \(I_\mathrm{m}\) calculation in current-clamp mode).
The rheobase can be calculated as:
Record – \(I_\mathrm{m}\) injection for the record at which the first AP is detected.
Exact – \(I_\mathrm{m}\) at the exact time-point of the first detected AP peak.
First-spike latency
The first spike latency is defined as the time from the start of the \(I_\mathrm{m}\) injection to the peak of the first action potential. If selected, users will be prompted to input the time (in seconds) that the \(I_\mathrm{m}\) injection starts. First spike latency will be calculated for all records that contain action potentials.
Inter-spike interval
The mean difference between the times of consecutive action potential peaks (i.e. the inter-spike-interval, ISI).
Spike freq. accommodation
Spike frequency accommodation (SFA) refers to a reduction in firing rate during a prolonged current injection. Two methods of SFA measurement are provided:
Divisor Method – The first ISI of the spike train divided by the final ISI in the spike train.
Local Variance – Introduced by Shinomoto et al. (2003), this measure captures the degree of irregularity of neuronal firing from the local variation of inter-spike intervals across the spike train (see Appendix I).