GUI overview
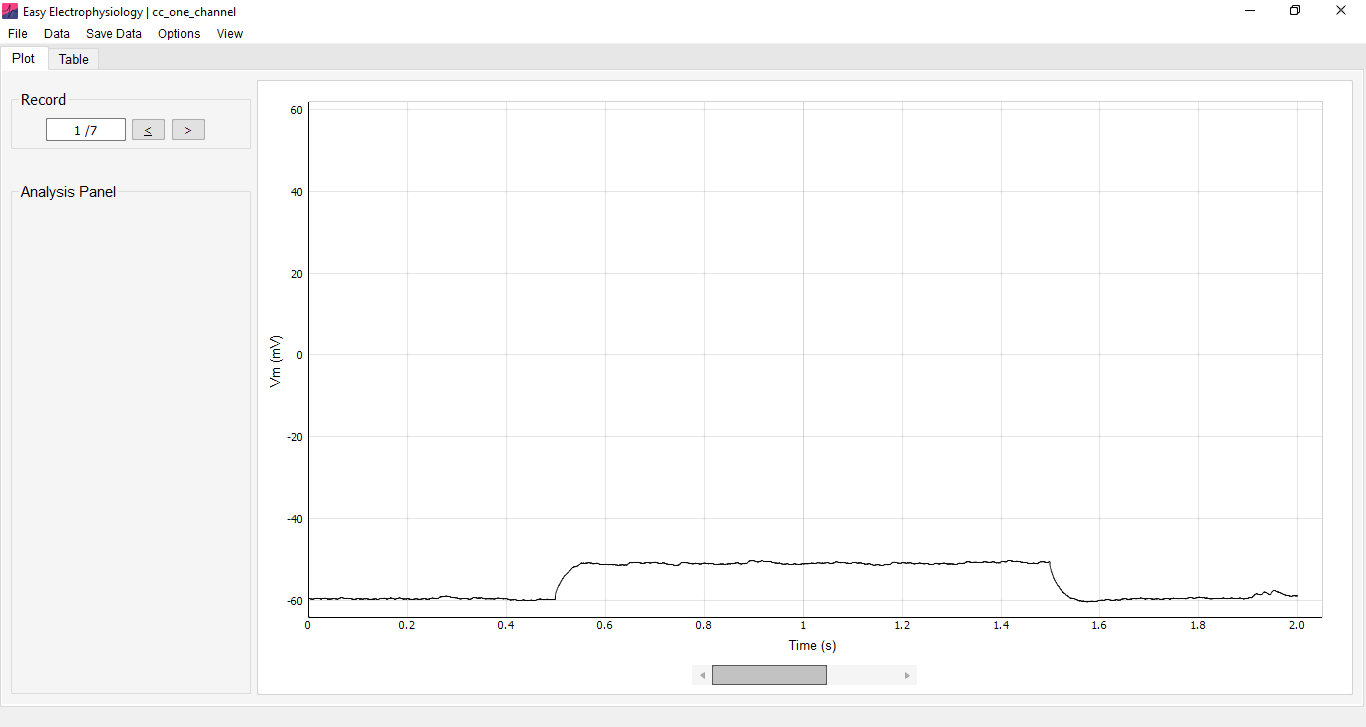
The Plot and Table views are the two main ways to visualize data and results in Easy Electrophysiology, accessed through the Plot and Table tabs. The Plot tab is used to view voltage (\(V_\mathrm{m}\)) and current (\(I_\mathrm{m}\)) traces, set up and run analysis, and visualize the results. The Table tab displays results in table format with options for saving to Excel or CSV.
To choose an analysis to run, select File › Open Analysis Window. When an analysis type is selected, the Analysis Panel on the left-hand side of the Plot tab will show the relevant options for running that analysis.
In the Table view, options for saving analysis results can be found using the dropdown in the Save Table box. Results can be saved as .xlsx (includes border formatting) or as .csv (no formatting). For some analyses (Events, Action Potential Counting, Input Resistance), checkboxes in the left-hand panel can be used to select which results to display.
Zooming and panning the graph
There are two zoom and pan modes available when using the Plot tab graph to explore your data. By default, One Button mode is selected and you can zoom by clicking anywhere on the plot and dragging the mouse to draw a box to zoom in to. To unzoom, right-click the graph and select Undo Zoom.
In the second mode, both mouse buttons can be used to navigate the graph. To access it, right-click anywhere on the graph and select Mouse Mode › Two button (pan left, zoom right). To zoom, hold down the right mouse button and drag the mouse to dynamically zoom in and out. To pan, click and hold down the left mouse button and drag to move the plot. You can still use Undo Zoom in this mode.