Statistics
Kolmogorov-Smirnov tests
Kolmogorov-Smirnov (KS) tests compare one sample with a normal distribution or compare two samples with each other. Open the analysis from Analysis › Kolmogorov-Smirnov. Raw data can be copied directly into the input table; the cumulative distribution does not need to be calculated first.
The KS statistic, denoted \(D\), is the maximum absolute difference between two cumulative distribution functions. For a one-sample test, it compares the sample’s empirical CDF with a specified theoretical CDF; for a two-sample test, it compares the empirical CDFs of the two samples.
Selecting a test
One Dataset (compare with normal distribution) – Compares the empirical CDF of Dataset 1 with a Normal CDF:
Estimate M and SD from sample (Lilliefors corrected) – Estimates the mean and standard deviation from the sample and applies the Lilliefors correction.
Supply population M and SD – Uses a supplied population mean and standard deviation.
Two Datasets (compare with each other) – Compares the empirical CDFs of Dataset 1 and Dataset 2. Set the alternative hypothesis to Two-Tailed, Dataset 1 Greater, or Dataset 1 Less.
Easy Electrophysiology uses scipy.stats.kstest for one-sample tests with supplied population parameters and for two-sample tests. When the mean and standard deviation are estimated from the sample, it uses statsmodels.stats.diagnostic.lilliefors.
Running and plotting the analysis
Run Analysis – Runs the selected KS test. The results show the sample size \(n\), KS statistic \(D\), and \(p\)-value.
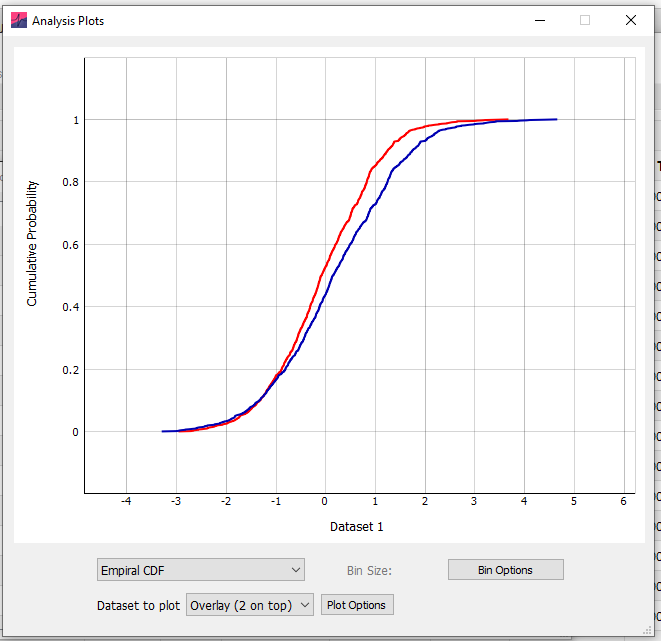
Plot Data – Opens a plot of Binned Cumulative Probability, Histogram, or Empirical CDF data. For two datasets, display either dataset individually or select Overlay (1 on top) or Overlay (2 on top).
Bin Options – Configures the bins used for binned cumulative-probability and histogram plots.
Plot Options – Configures the appearance of the current plot.
Summary statistics
Summary statistics can be calculated from data displayed in the results table. Selecting Summary Statistics on the Table tab displays the mean, standard deviation, and standard error of each parameter by default.
Calculated statistics
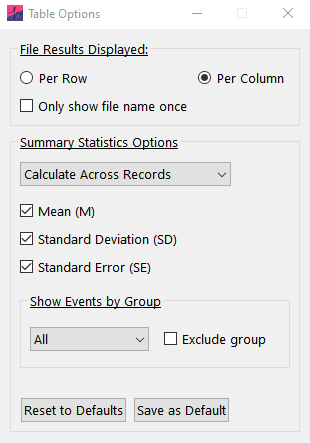
Open Analysis › Table Options to select the calculated statistics:
- Mean (M)
- Standard Deviation (SD)
- Standard Error (SE)
At least one statistic must be selected. Parameters for which summary statistics are not meaningful, such as record number and event time, are omitted. A Count column reports the number of rows summarized. For Events and AP Kinetics, this equals the number of events or action potentials; for other analyses, it equals the number of records.
Calculation and table layout
Calculate Across Records – Calculates summary statistics across records.
Calculate Within Records – Calculates summary statistics separately within records.
Per Row – Stacks analyzed files vertically. Only show file name once prevents repeated file names in this layout.
Per Column – Displays analyzed files horizontally in separate columns. This is the default layout.
For Events results, Show Events by Group selects All events or Group 1-5. Select Exclude group to show all events except the selected group.
Reset to Defaults restores the default table options. Save as Default saves the current options as the defaults for future use.